A while ago a policy change in the US prompted coders and scientists to start downloading and collecting NASA data. I dabbled a bit and ended up with a huge repository of data for land elevation for the entire globe. It was too large to practically work with and it didn’t relate directly to my own research so it has been sidelined for a long time.
Now that I made this site there is a place I can put the results and update my slow but steady progress.
I tweeted more than 1 year ago the largest plot of the data that I was able to run on my laptop at that time. At last I think I’ve been able to make the data workable by converting format and coarse-graining heavily. So hopefully in the coming weeks I can make some pretty plots and create working model for the globe.
I’ve yet to find a computer powerful enough to plot a window much bigger than this – its A LOT of data (Scandinavia) pic.twitter.com/5MC3WuxxUs
— Lee Burton (@leeaburton) January 6, 2017
I still have no real goal of what to do with this info but I think it could be the basis of a lot of interesting stuff in the future.
– update 27 March 2018 –
Ok it seems I was finally able to get the ball rolling. This is the first major chunk of data I’ve been able to extract and work with:
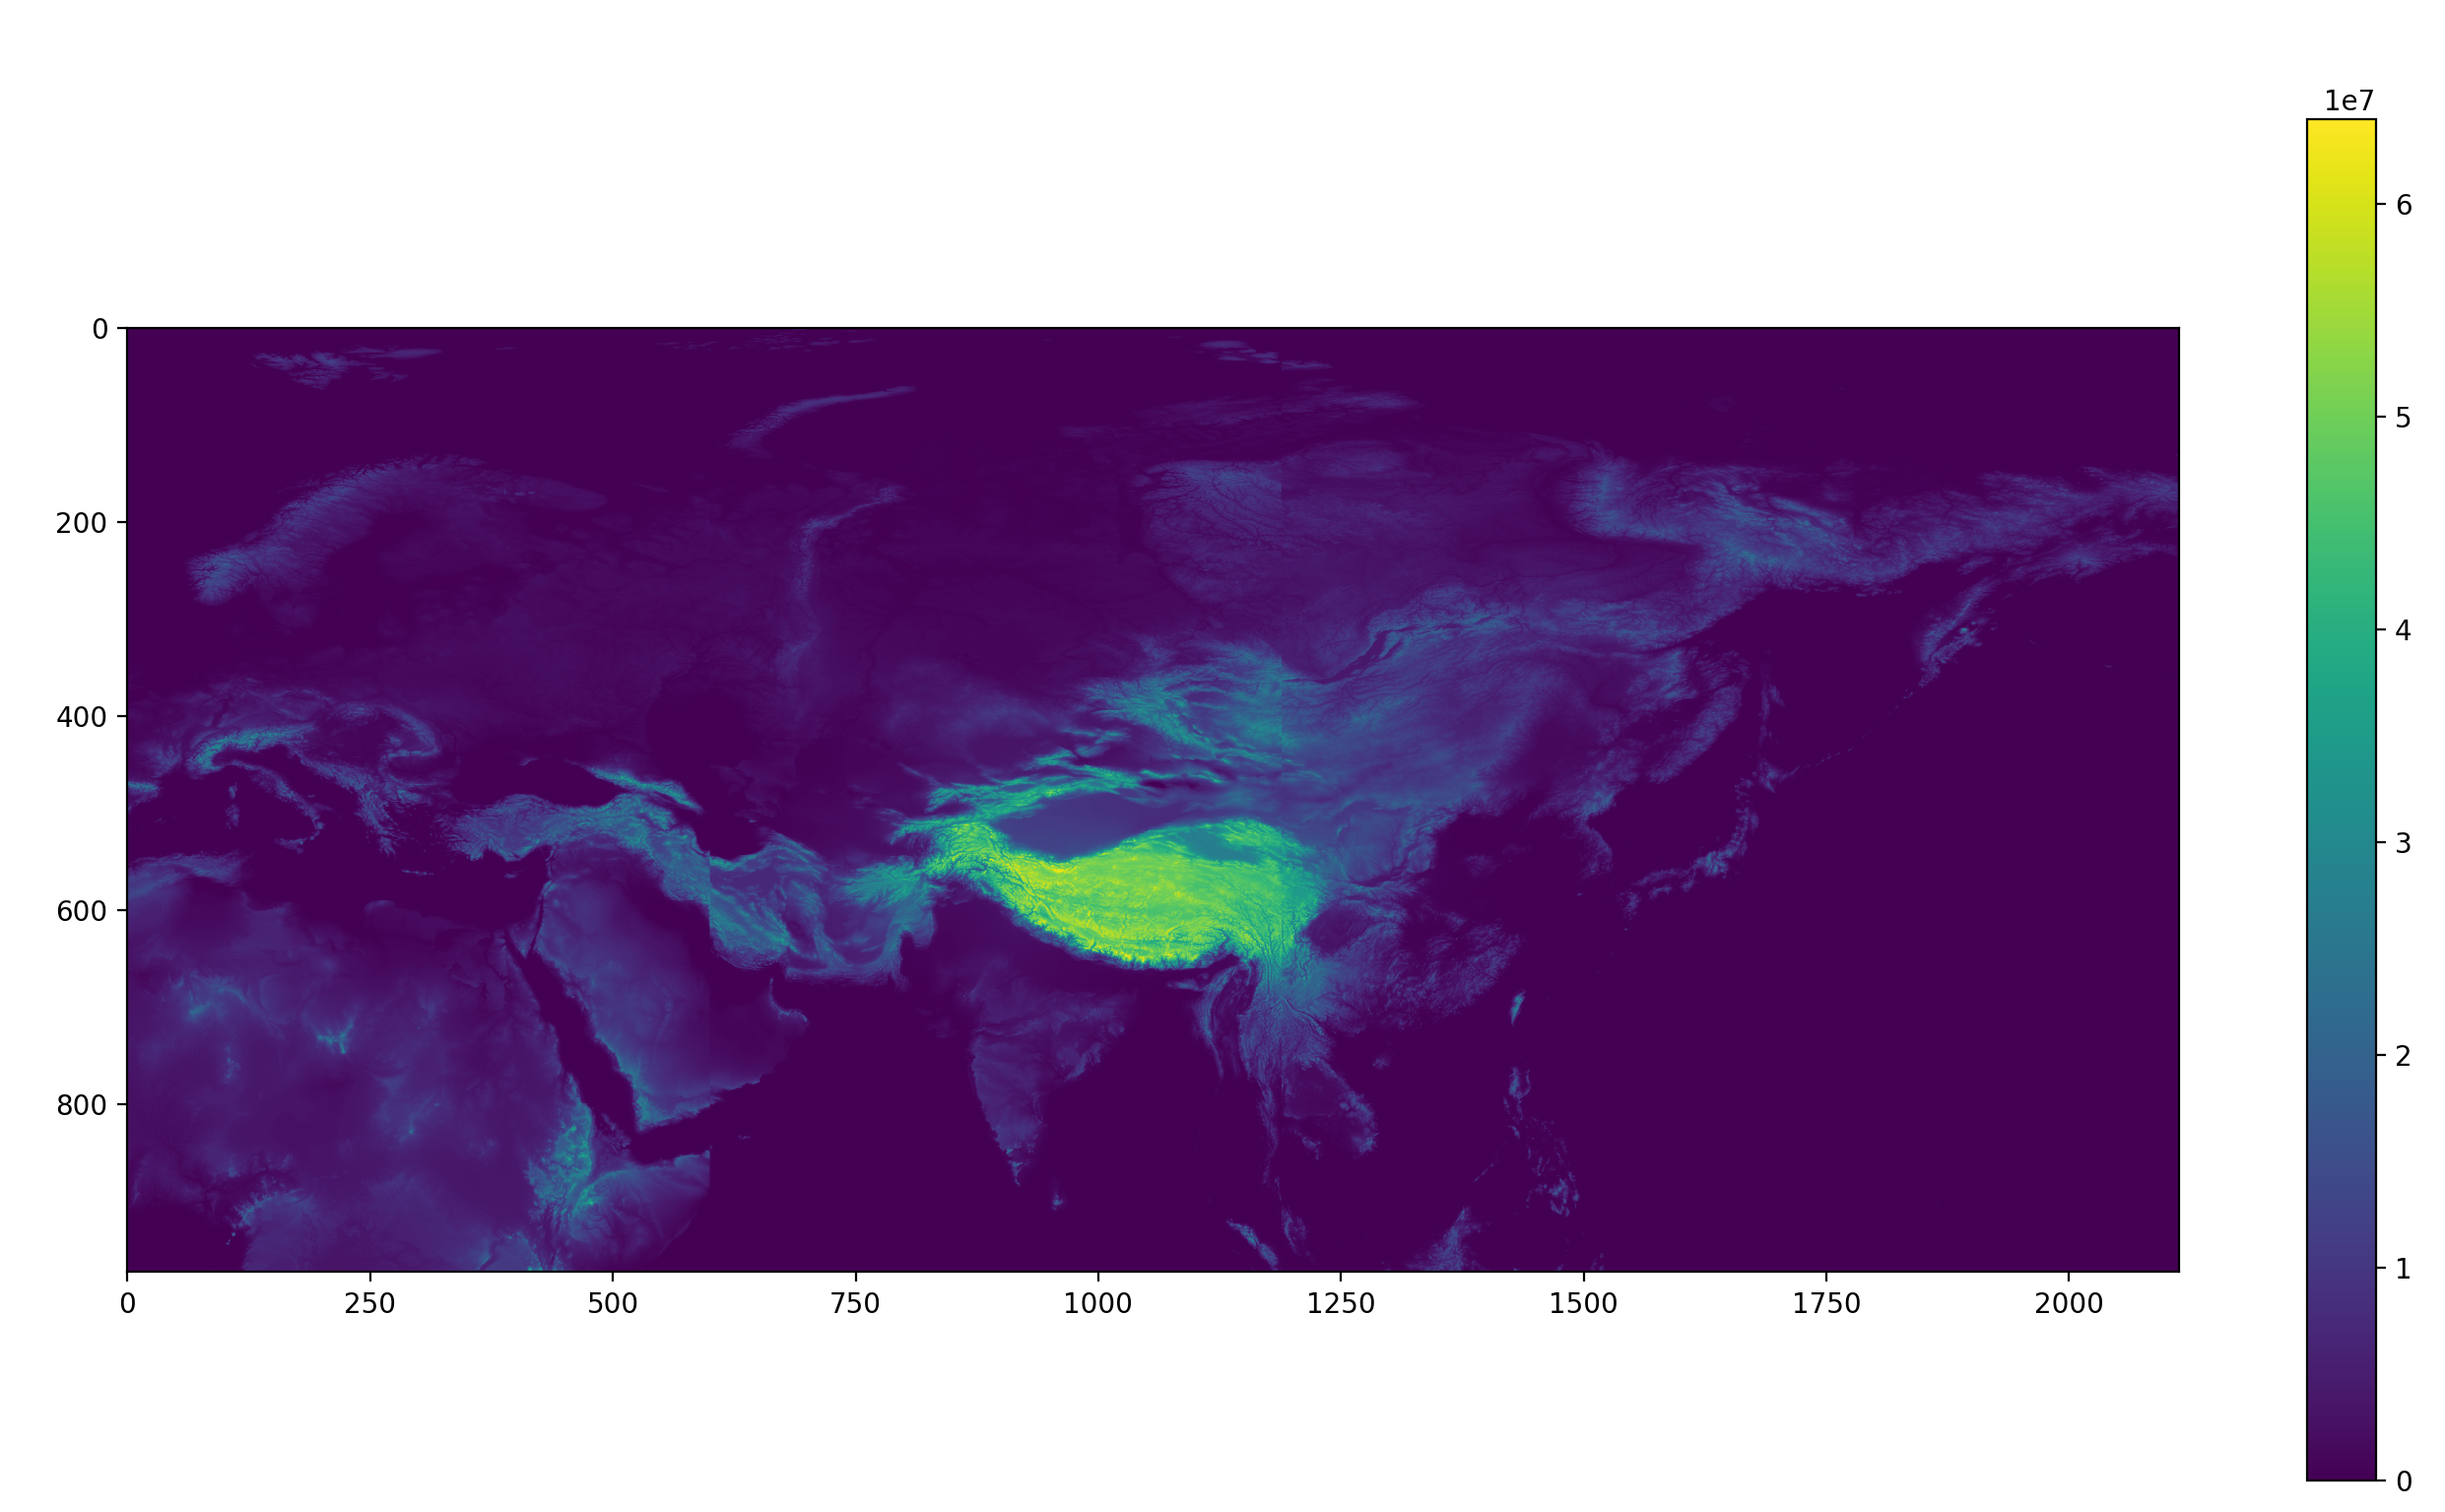
North-east globe elevation:
finally a complete portion of the globe, the elevation of Tibet dominates the surrounding areas
It should be recognisable as the North-east quarter of the globe, as defined by the prime meridian and equator. It’s enough to play around with for now but of course i still want to work on getting the full world data.
OK, this is a way clearer representation of what I have:
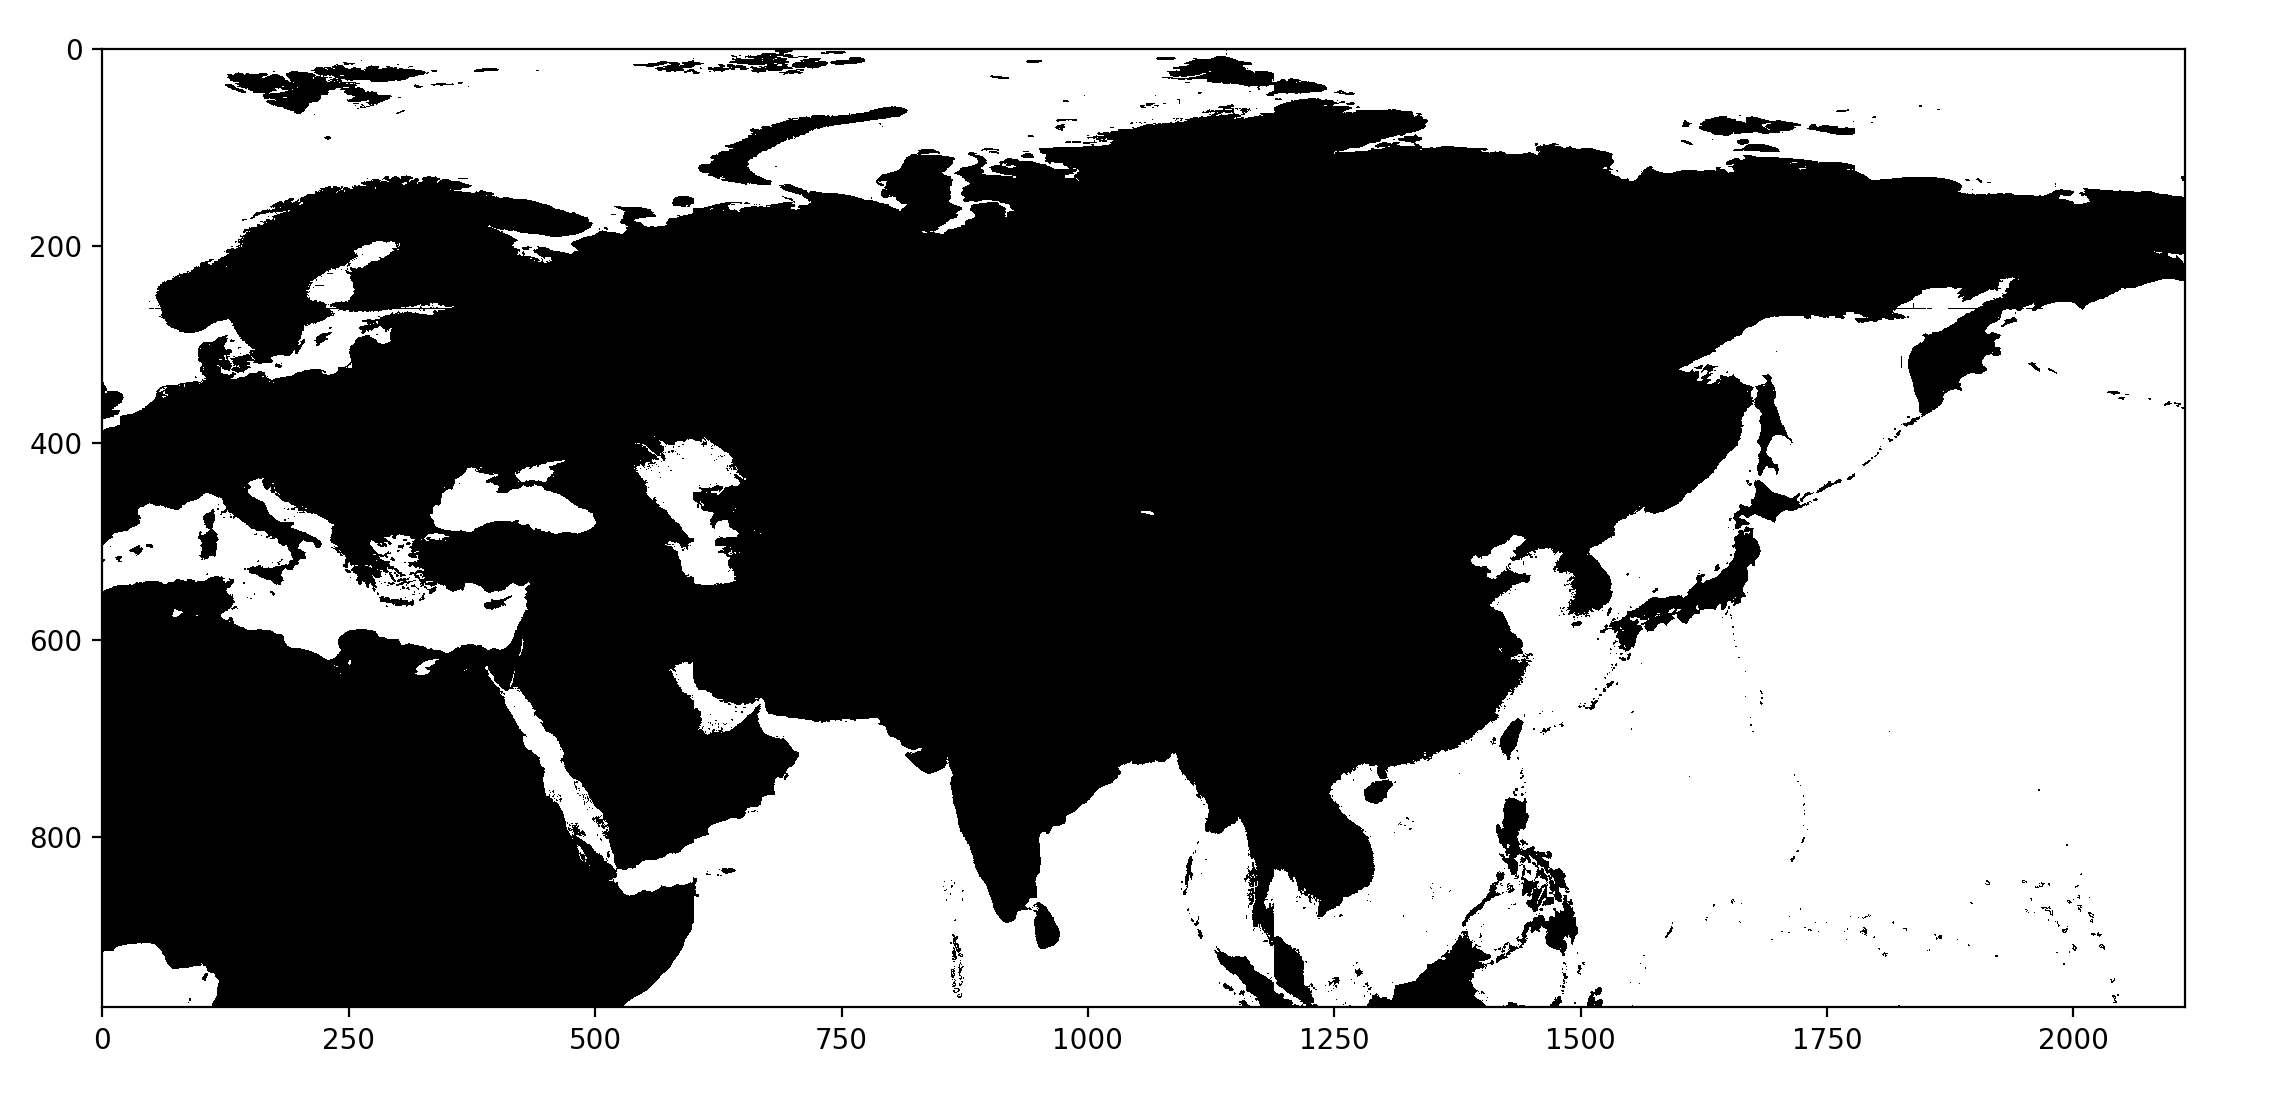
North-east globe above sea level:
splitting the data into above sea level or not gives a much familiar image of the world
This is found by splitting the data into black and white. White for any point where the elevation is zero with respect to sea level and black for anything higher than that.
– update 13 April 2018 –
Right the north-west hemisphere is finished. And there’s a lot of interesting things to see if I use the same methods as before to plot this data:
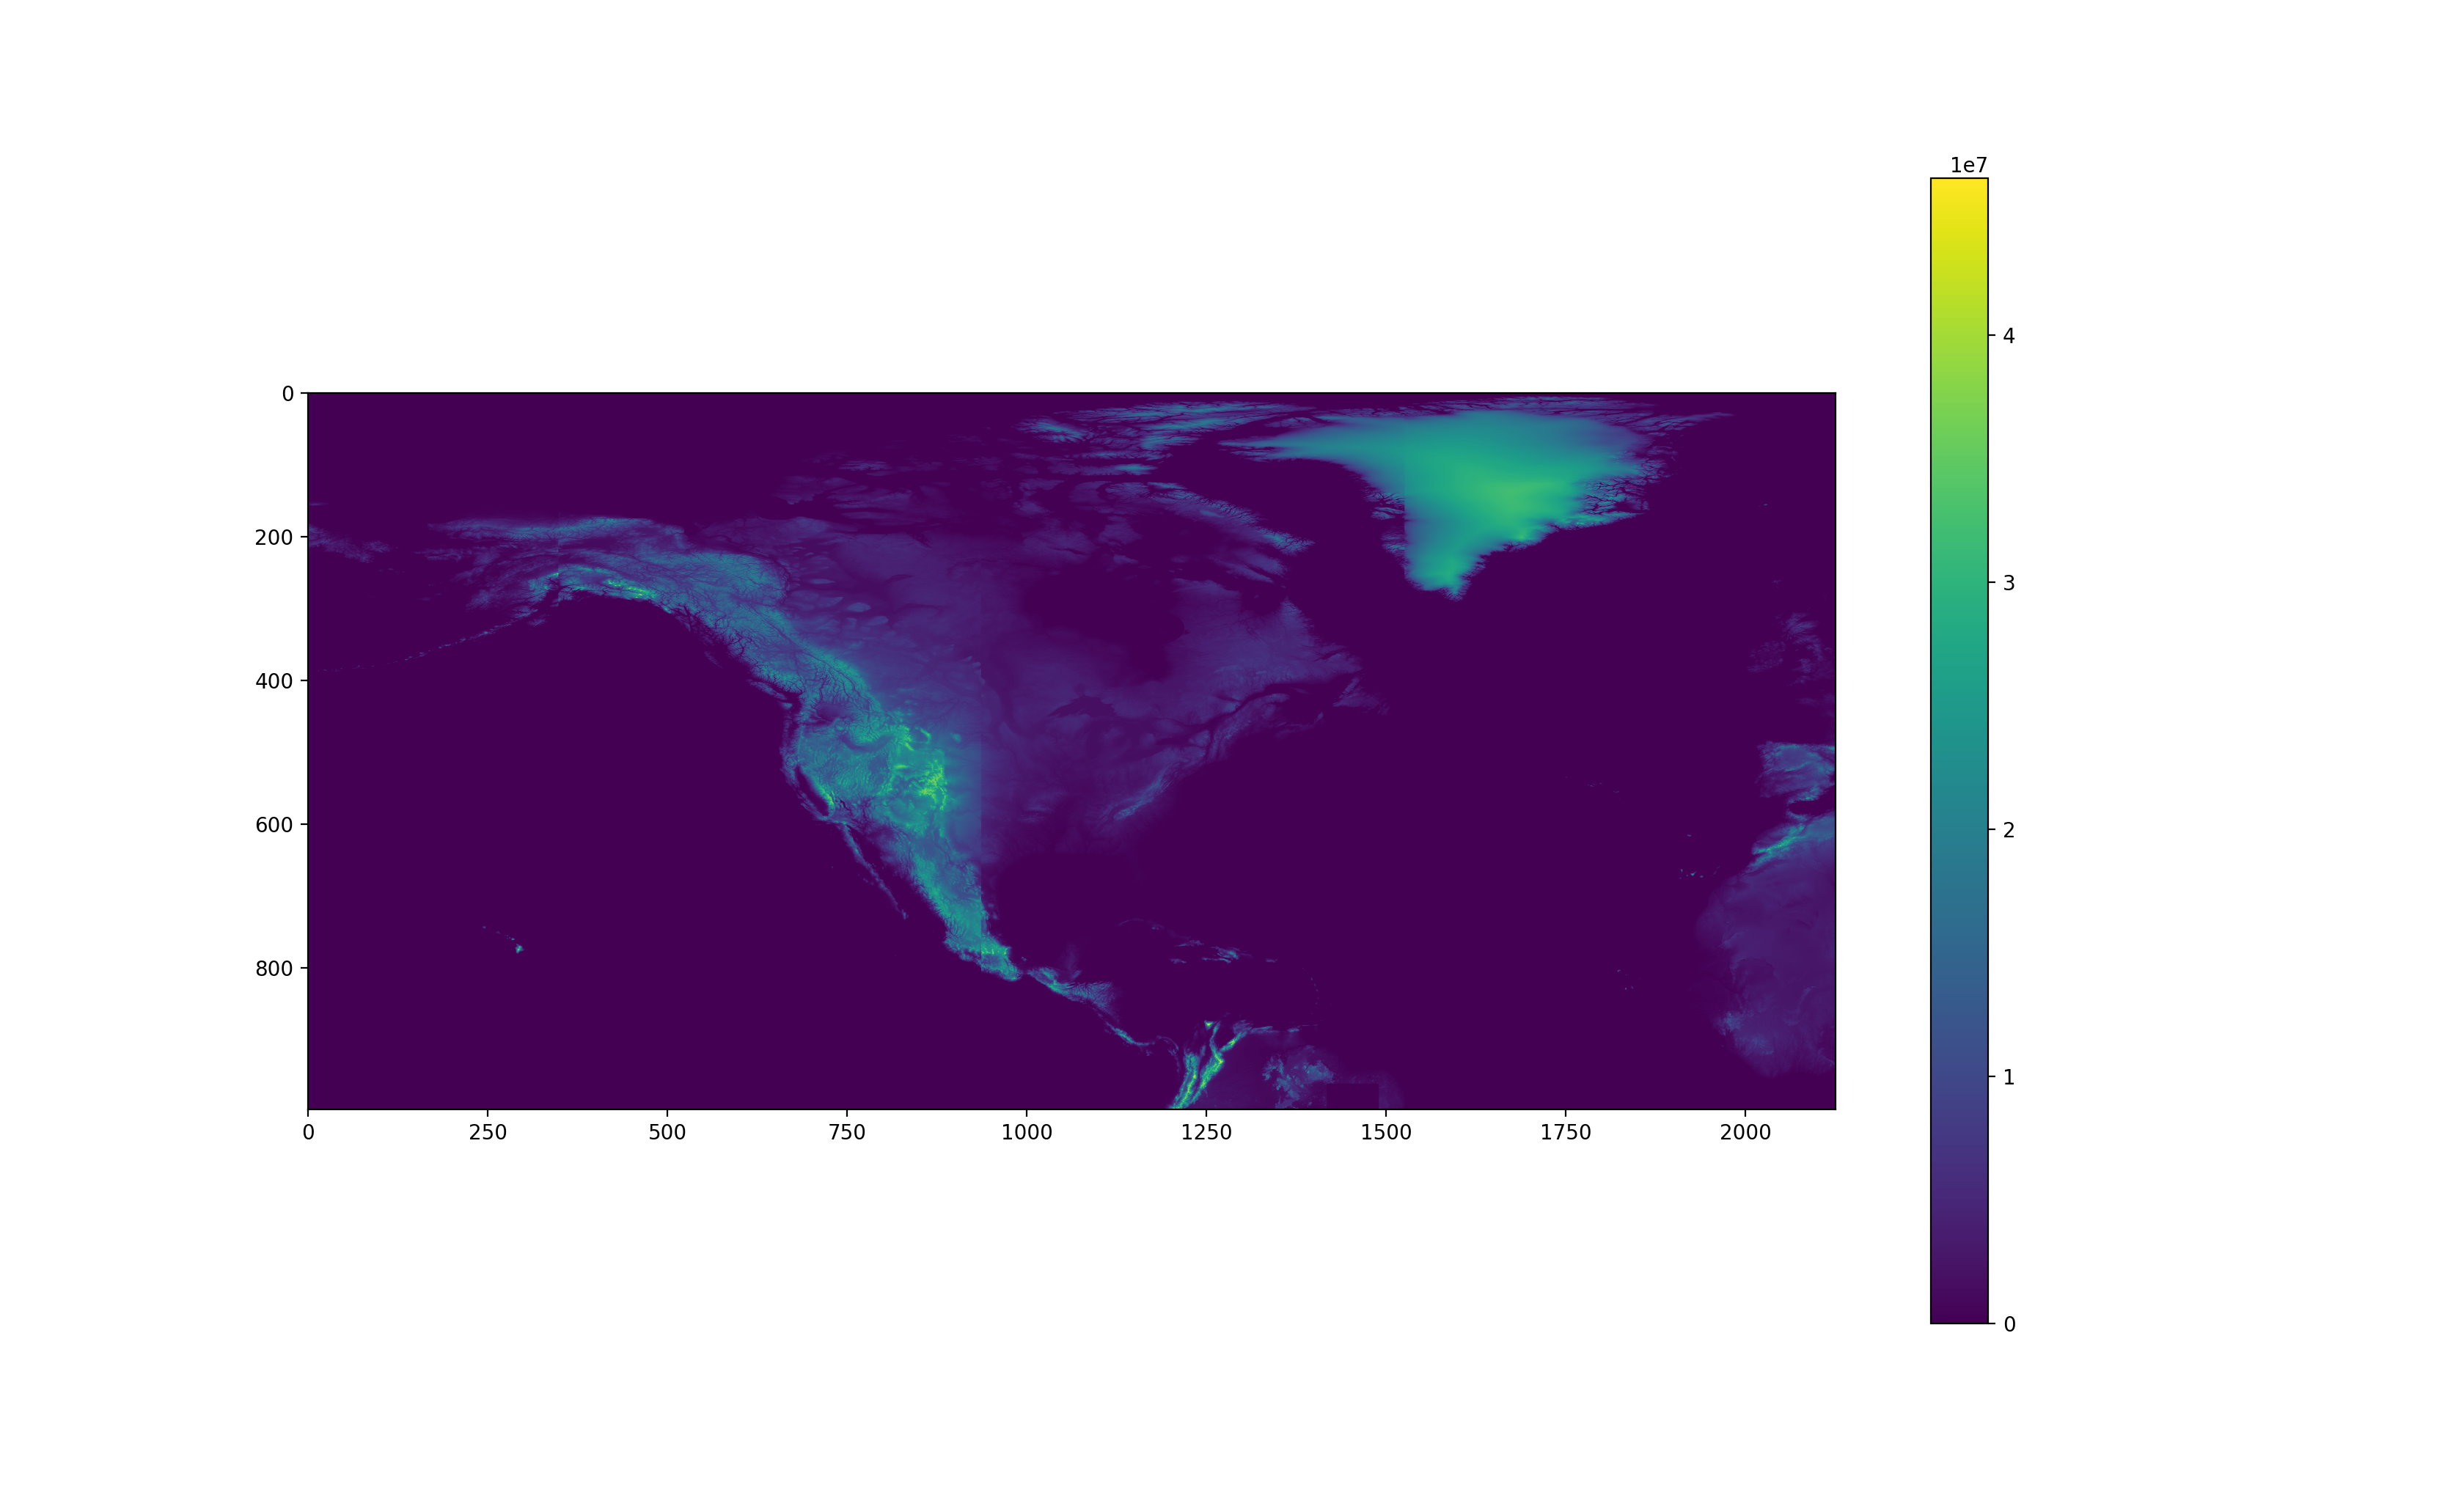
North-east globe elevation:
finally a complete portion of the globe, the elevation of Tibet dominates the surrounding areas
This method of plotting is useful because it looks like there are a couple of seams in the data, one on the west of Greenland and one down the middle of North America. These vertical discontinuities could either be due to the way I’m plotting the data or the raw data itself. I need to really get in and start digging
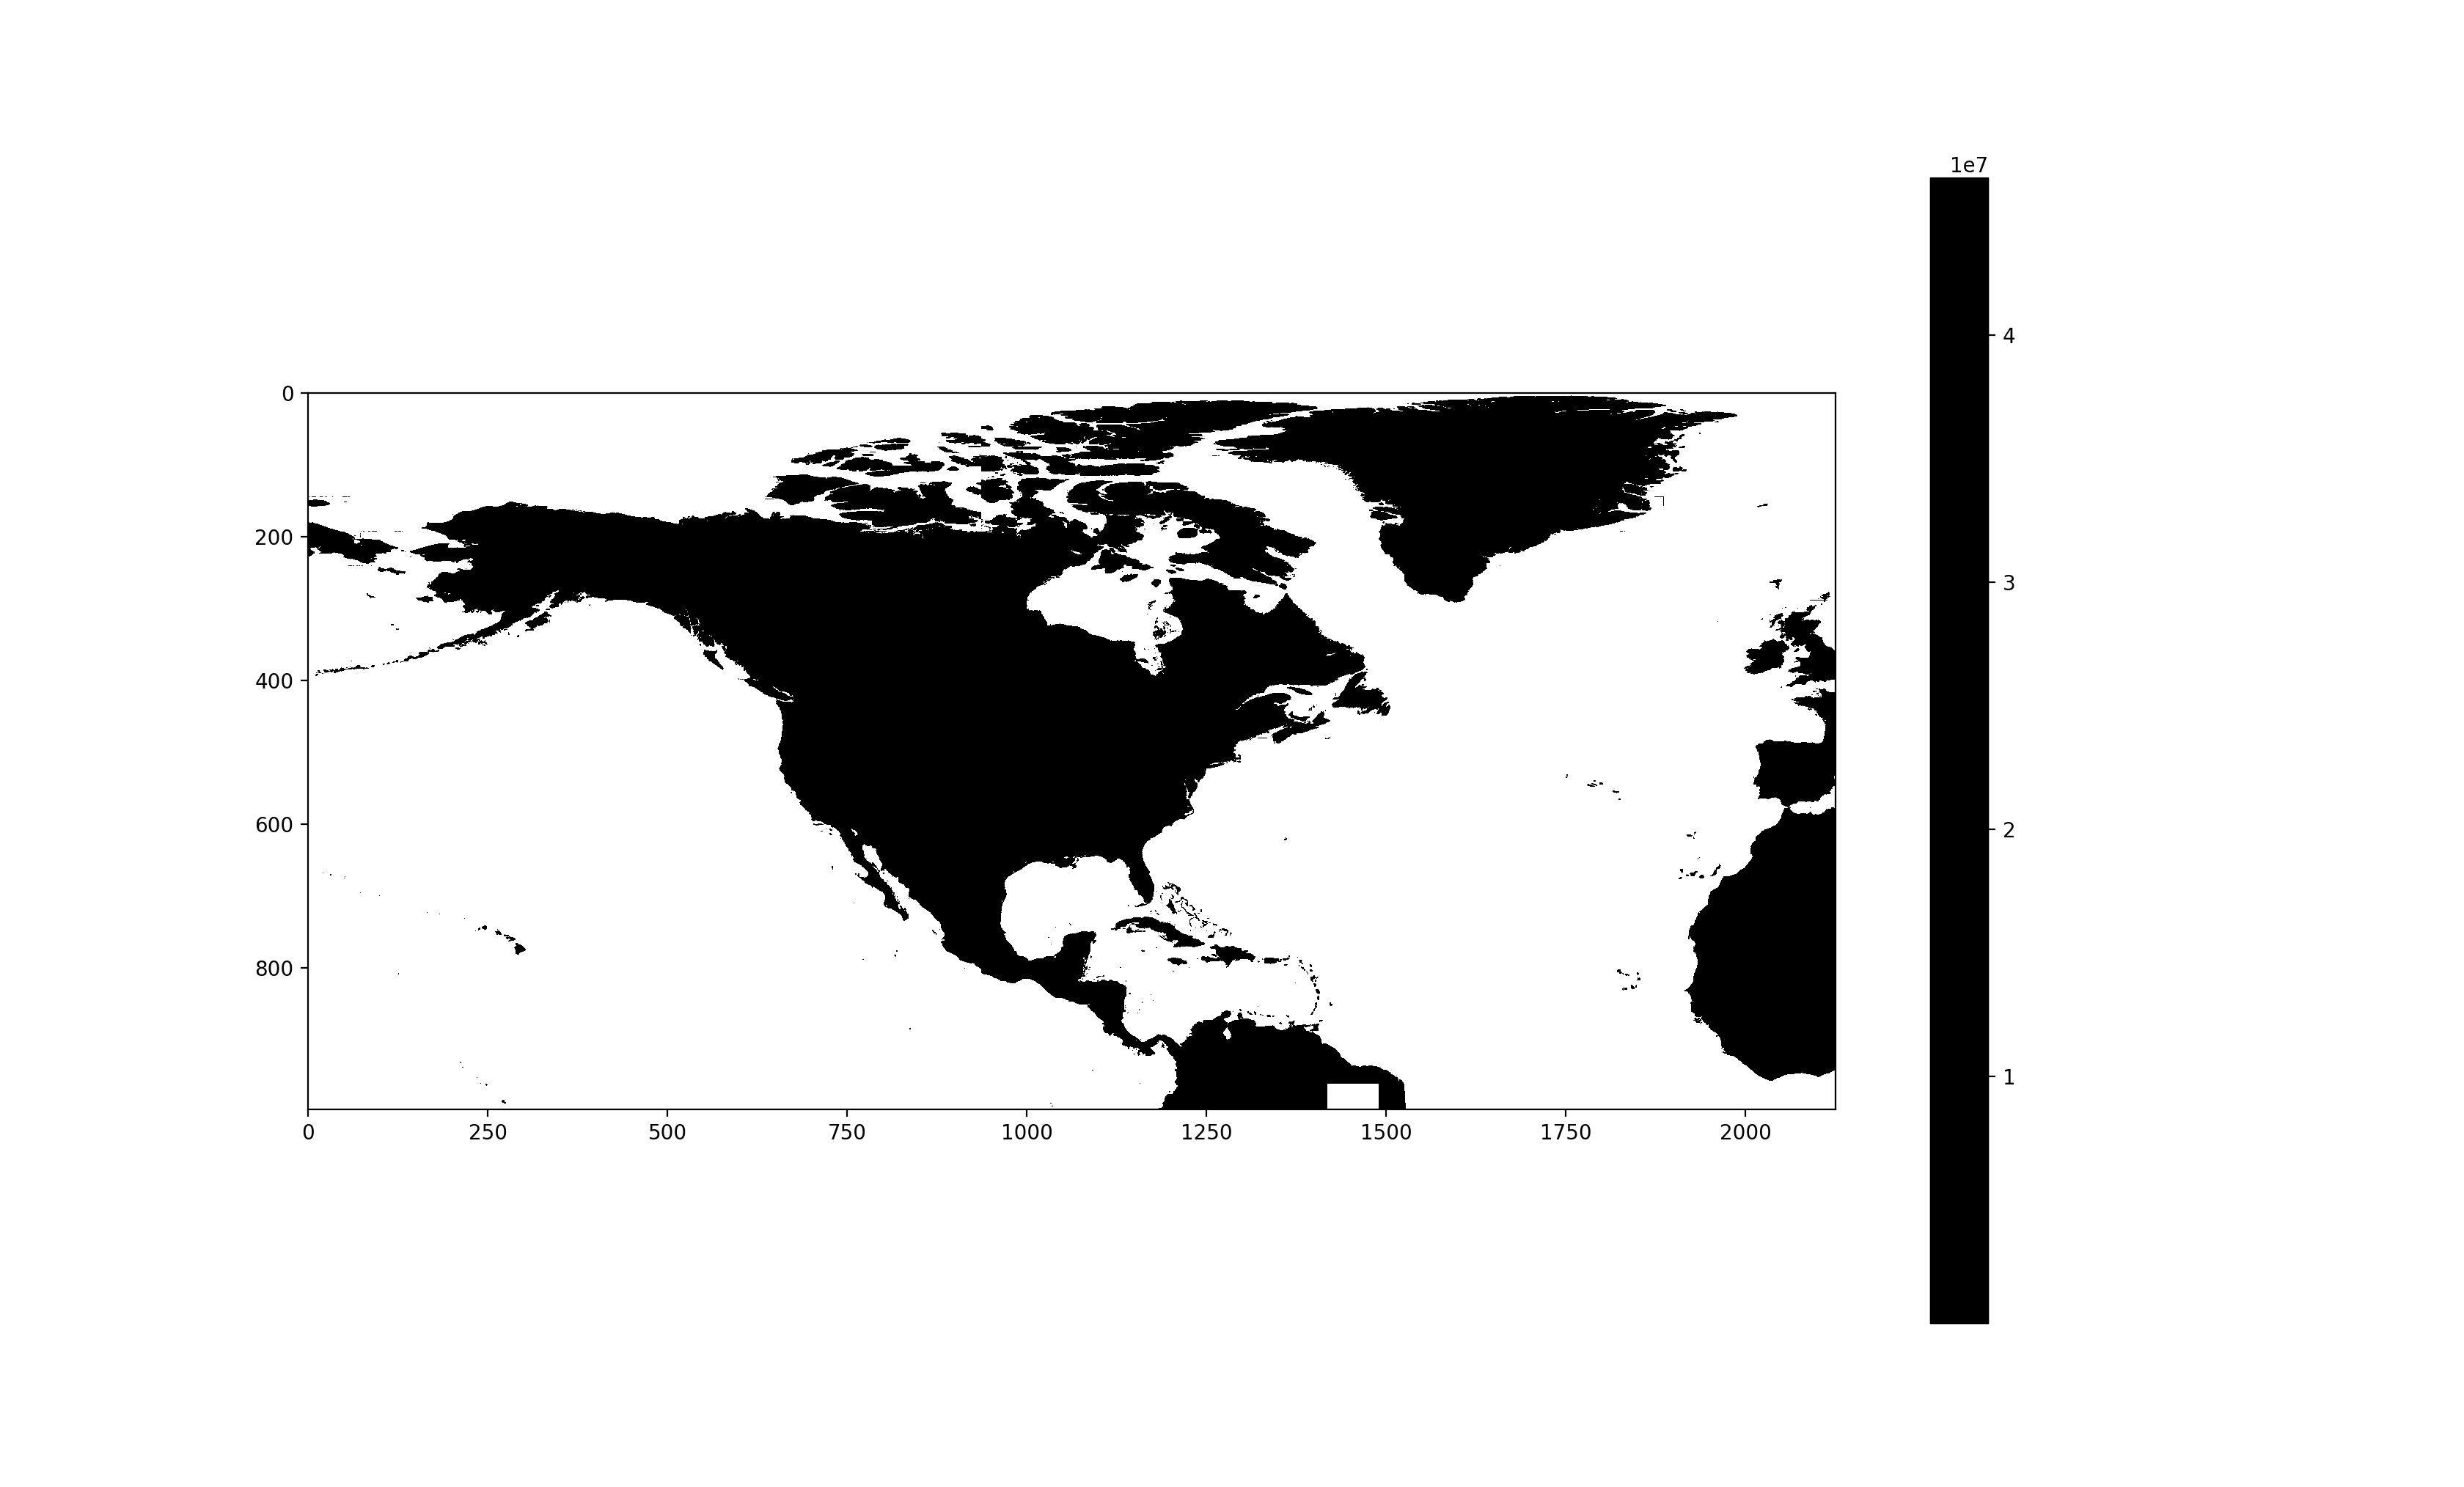
North-east globe above sea level:
splitting the data into above sea level or not gives a much familiar image of the world
This other way of plotting is great because it shows there is a patch of data in Brazil missing entirely! As far as i can tell there is no plot missing for the north-eat hemisphere so my code itself must be working. I either need to track down this raw data or in a worse-case scenario I can just set the entire block to be 1 (meter above sea level) and proceed with a binary model of just land/sea info.
update: I just checked and there is elevation above sea level in the raw data for at least one part of Brazil that is not being shown on my large size maps:
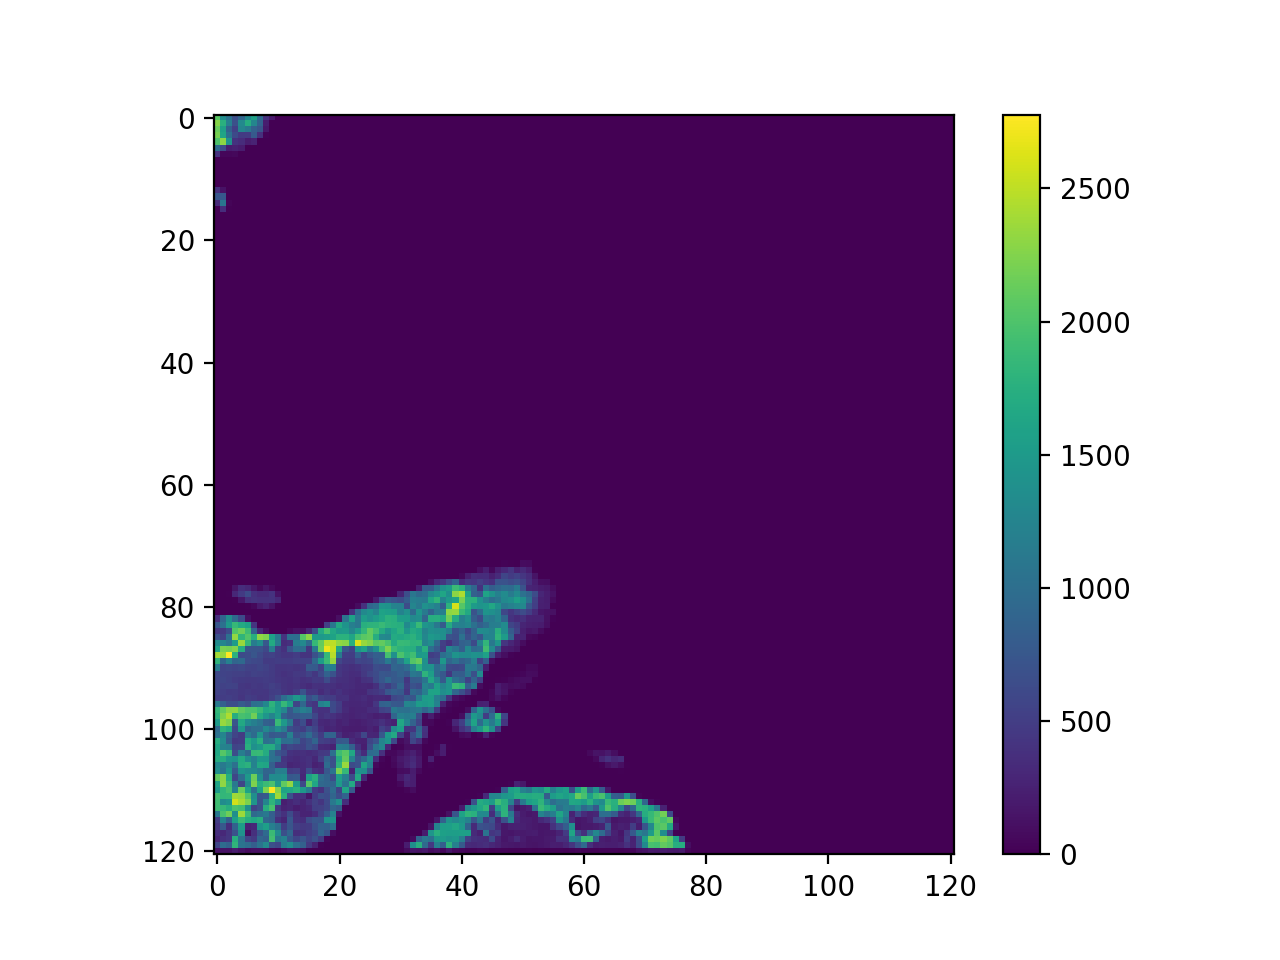
East coast Brazil:
This is the first emergence of land for east coast brazil (heading westwards) that does not appear on the larger maps of the north west-hemisphere.
The data shown in the above figure should appear around 1625 on the x axis of the larger maps. I’m not sure how it’s happened since the same code had no problem plotting this data so how did it miss it in the larger map? I might have to change the way i’m piecing all the data together